Introduction
Premenstrual syndrome (PMS) is a prevalent disorder characterized by physical, emotional, and behavioral symptoms occurring during the luteal phase of the menstrual cycle. According to the American College of Obstetricians and Gynecologists (ACOG), PMS is diagnosed when these symptoms cause measurable functional impairment [1]. Premenstrual Dysphoric Disorder (PMDD), a more severe form, is defined by the American Psychiatric Association (APA) as involving marked anger, irritability, and tension [2]. The International Society for Premenstrual Disorders (ISPMD) requires at least one psychological or behavioral symptom for a clinical diagnosis [3]. Beyond hormonal fluctuations, PMS significantly impairs daily functioning and quality of life, encompassing both psychosocial and biological components [1,4].
The prevalence of PMS varies due to differences in diagnostic criteria and assessment methods. Commonly used tools include the Premenstrual Syndrome Scale (PMSS), the Daily Symptom Rating Scale (DRSP), the Menstrual Distress Questionnaire (MDQ), and the Premenstrual Assessment Form (PAF); despite the validity of these tools, inconsistencies in diagnostic approaches contribute to discrepancies in prevalence rates across studies and populations [5,8]. A global meta-analysis reported that 47.8% of reproductive-aged women experience PMS, with prevalence ranging from 12% in France to 98% in Iran [9]. In Turkey, a recent systematic review estimated a prevalence of 52.2%, increasing to 59% among high school students and 50.3% in university students [10]. Large-scale epidemiological analyses from 1990 to 2019 indicate a 46.5% rise in PMS cases, though age-standardized prevalence remains stable, highlighting the influence of geographic, cultural, and lifestyle factors [11].
PMS is associated with significant reductions in quality of life, affecting physical, psychological, and social well-being. Studies demonstrate its adverse impact on daily activities, interpersonal relationships, and mental health [4,12]. Additionally, PMS correlates with increased stress levels and decreased occupational performance, particularly in high-responsibility professions such as healthcare [13,15]. Research on student populations suggests that PMS negatively affects academic performance and overall well-being [16,17]. These findings emphasize the fact that PMS is not merely a hormonal phenomenon but a multifaceted health issue with broad implications for individual and societal functioning.
The aim of this study was to determine PMS prevalence, identify risk factors, and evaluate its impact on quality of life in Turkey. Given the complex nature of PMS, a multidisciplinary approach is essential for effective management. The findings are expected to contribute evidence-based insights to clinical practice and public health strategies, improving the understanding of PMS and its implications for women's health.
Methods
This cross-sectional study was conducted between January and April 2023 at a university-affiliated teaching hospital. Ethical approval was obtained from the Institutional Review Board of the Faculty of Medicine of Marmara University (Protocol No: 09.2018.685). The sample size was calculated using GPower 3.1.9.7, indicating a minimum of 385 participants. Depending on the length of the survey it was expected that 10-30% of the respondents might have not completed the entire questionnaire. Hence, we estimated to include 1.5 times more participants than the calculated sample size. A total of 578 women aged 18–45 years attending gynecology outpatient clinics were included. Convenience sampling was used given the outpatient setting and study feasibility.
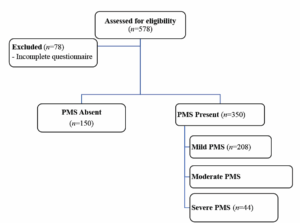
Exclusion criteria were: women with a history of malignancy, chronic systemic illness, use of antihypertensive or lipid-lowering medications, current hormonal or psychiatric therapy and menstrual irregularities. Participant recruitment is shown in Figure 1 (Figure 1) to demonstrate sampling methodology and assess potential recruitment bias.
After obtaining written informed consent from all participants, demographic, anthropometric (height, weight, body mass index [BMI]), and socioeconomic data were collected via face-to-face interviews in private consultation rooms. All questionnaires were self-administered.
Validated used tools
The Premenstrual Assessment Form (PAF)
The PMS scale was originally introduced by Halbreich et al. [8] to assess premenstrual symptoms. It was later adapted to Turkish language by Dereboy et al. [18], improving its reliability. This scale systematically assesses symptoms experienced by respondents over the last three menstrual cycles. In the study by Dereboy et al. [18], participants rated their symptoms on a scale from 0 to 3, where 0 = "none", 1 = "mild", 2 = "moderate", and 3 = "severe". The total score is obtained by summing up the points given for each symptom. This total score reflects the severity and frequency of PMS, helping to determine its overall impact. The total score was calculated by summing the item scores and dividing by the number of items. Scores below 1.7 indicated no PMS, 1.7–2.8 indicated mild, 2.8–3.7 indicated moderate, and scores above 3.7 indicated severe PMS [18].
Quality of Life short form scale (SF-36)
The SF-36 scale developed by Ware et al. [19], was used in the present study to evaluate physical and mental health. The scale consists of 36 items which are included in eight domains: physical functioning, limitations due to physical health, bodily pain, general health, vitality, social functioning, limitations due to emotional problems, and mental health. Higher scores reflected better well-being. Scoring was performed by computing the mean values of each domain [20].
Statistical analysis
Statistical analyses were conducted using SPSS version 28.0 (IBM SPSS Statistics). Normality of continuous variables was assessed using the Kolmogorov–Smirnov test. Descriptive statistics were expressed as mean ± SD or median and interquartile range (IQR), as appropriate. Categorical variables were reported as frequencies and percentages.
Bivariate comparisons were performed using Pearson’s Chi-square test for categorical variables. For continuous variables, the Kruskal-Wallis test was applied when was not normally distributed,, with Bonferroni-adjusted post-hoc pairwise comparisons (p<0.008). Other analyses were considered significant at a p<0.05. Correlations between PMS scores and SF-36 domain scores were assessed using Spearman’s rank correlation coefficients with 95% confidence intervals (CIs).
Multivariable logistic regression was used to identify independent predictors of PMS status. Variables significant during univariate analysis (p<0.05) were included as covariates: age, BMI, education, marital status, smoking, and caffeine intake. Interaction terms (Age × Education, BMI × Smoking, Marital Status × Caffeine) were tested to assess effect modification. Model fit was evaluated using the Hosmer–Lemeshow test (p=0.72), and the model performance was assessed using Nagelkerke R². Multicollinearity was excluded (VIFs < 2.0). For all analyses statistical significance set at p<0.05.
Results
Participant characteristics
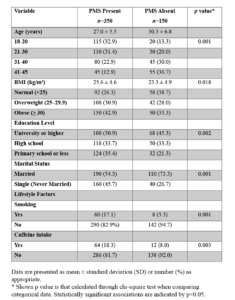
A total of 578 women completed the questionnaires. After excluding 78 women due to incomplete responses to all the questions, 500 participants were included in the final analysis. The mean age was 28.01 ± 6.05 years (range: 18–45), and the mean BMI was 25.0 ± 4.8 kg/m². Nearly half of the participants were single (45.7%), and 67.4% had at least a high school education. Smoking was reported by 17.1% of the participants, and 18.3% consumed at least one daily cup of coffee. A total of 73.7% of the participants were overweight or obese (BMI ≥ 25 kg/m²).
PMS prevalence and severity
The overall prevalence of PMS was 70.0% (95% CI: 66.00–74.00). Based on severity levels, 41.6% of participants had mild PMS (95% CI: 37.20–46.10), 19.6% had moderate PMS (95% CI: 15.90–23.30), and 8.8% had severe PMS (95% CI: 6.30–11.80).
Scale validation and factor analysis
Factor and construct validity analyses were conducted for both PMS and SF-36 instruments. Items with factor loadings below 0.50 were excluded. Sampling adequacy was confirmed by Kaiser-Meyer-Olkin (KMO) and Bartlett’s tests. For the PMS scale: KMO = 0.961, χ² = 29,474.63, df = 4,465, p<0.001 (highly significant); for the SF-36: KMO = 0.888, χ² = 5,747.90, df = 630, p<0.001 (highly significant). The six SF-36 domains were retained.
Univariate analysis and bivariate associations
Significant group differences were observed in demographic and lifestyle variables (Table 1). 32.9% of women with PMS were of age 18–20, compared to 13.3% in the non-PMS group (p<0.001, highly significant). Conversely, there were more women aged 41–45 years in the non-PMS group (36.7%) than in the PMS group (12.9%). More obese women were present in the PMS group than in the non-PMS group (42.9% vs 33.3%, p=0.018, moderately significant).
There were more women having a university or higher education in non-PMS group (45.33%), while the PMS group had more women with primary or lower education (35.4%) (p=0.002, moderately significant). A greater proportion of single women were in the PMS group (45.71%) when compared to married women (p<0.001, highly significant). Smoking and caffeine intake were significantly higher among women with PMS (p=0.001 and p=0.003, respectively, statistically significant).
Multivariable logistic regression analysis
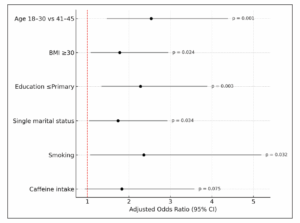
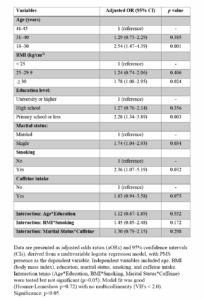
As shown in Table 2 (Table 2), multivariable logistic regression analysis identified age, BMI, education level, marital status, smoking, and caffeine intake as independent factors associated with PMS risk. Women aged 18–30 years had a significantly higher odds for PMS compared to those aged 41–45 (aOR: 2.54; 95% CI: 1.47–4.39; p=0.001). BMI ≥ 30 was associated with increased odds (aOR: 1.78; 95% CI: 1.08–2.95; p=0.024), and lower education levels (≤ primary) showed a strong association with PMS (aOR: 2.28; 95% CI: 1.34–3.89; p=0.003). Single marital status (aOR: 1.74; 95% CI: 1.04–2.93; p=0.034) and smoking (aOR: 2.36; 95% CI: 1.07–5.19; p=0.032) were also significant predictors. Although caffeine intake trended towards increased risk, it was not statistically significant (aOR: 1.83; 95% CI: 0.94–3.58; p=0.075). Interaction terms (Age*Education, BMI*Smoking, Marital Status*Caffeine) were included but did not reach significance (p>0.05), confirming the absence of interaction effects. The model showed good fit (Hosmer-Lemeshow p=0.72) with no multicollinearity (VIFs <2.0). Statistical significance was set at p<0.05. Figure 2 (Figure 2) illustrates these findings, summarizing adjusted odds ratios and confidence intervals for key predictors.
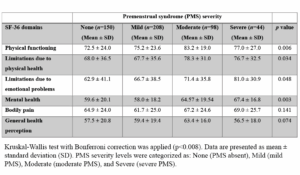
Quality of life domain scores according to PMS severity
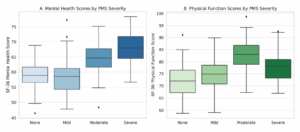
Table 3 (Table 3) summarizes mean scores of the SF-36 domains according to PMS severity. The mean score of the Mental Health domain was significantly different between women with mild and moderate PMS (p=0.003; highly significant). Same result was found between women with mild and severe PMS (p=0.003; highly significant) (Figure 3A). The mean score of Physical Functioning domain significantly differed between the women without PMS and those with moderate PMS (p=0.006; statistically significant) (Figure 3B). There was no difference of the other scores of the SF-36 subdomains between the PMS groups.
Correlations between PMS severity scores and SF-36 domain scores
Spearman’s rank correlation indicated a low positive correlation between PMS severity scores and SF-36 Mental Health domain scores (r=0.45; 95% CI: 0.31–0.57; p <0.001), and the mean score of Physical Function subscale (r = 0.32; 95% CI: 0.18–0.45; p = 0.003). The scores of other SF-36 subscales were not significantly correlated with PMS severity.
Discussion
In this study, the prevalence of PMS was determined to be 70%, with young age, high BMI, low educational level, being unmarried, and smoking being confirmed as independent factors associated to PMS in our multivariate logistic regression model. Caffeine intake, although significant in bivariate analysis, was not an independent predictor. According to the scores of SF-36 domains, individuals diagnosed with PMS exhibited higher scores in physical function and mental health domains; however, no significant differences were observed for the other domains. These findings suggested that while PMS may influence an individual's daily life, its overall effect on the quality of life might have been more limited than expected.
The prevalence of PMS varied substantially across regions, primarily due to inconsistencies in diagnostic criteria and assessment tools. A recent meta-analysis estimated the global prevalence at 47.8%, with higher rates observed in Asia (51.5%) compared to Europe (44.6%) and North America (36.3%) [9]. In Turkey, population-based studies have reported rates ranging from 44.7% to 52%, with 49.2% observed among women aged 18–25 [10,21,22]. The higher prevalence in our sample could be attributed to the use of the comprehensive 95-item PAF, which captured a broader range of symptoms than the DSM- or the ACOG-based instruments. These findings highlighted the importance of using standardized, culturally validated tools in global comparisons of PMS prevalence [8].
PMS prevalence shows substantial regional variation, mainly due to differences in cultural norms, symptom reporting behaviors, and choice of diagnostic criteria. Studies from East Asia have reported PMS prevalence rates ranging from 21% to 25% [23]. In contrast, studies from the Middle East have documented higher rates between 70%–80%, likely reflecting cultural influences and increased symptom awareness [24]. The elevated PMS prevalence observed in our study differed from East Asian data but aligns with findings from Middle Eastern cohorts. This pattern could be attributed to the broader symptom detection capacity of the Turkish version of the PAF scale and the demographic profile of our sample. There is a need for using standardized diagnostic tools to enable valid cross-cultural comparisons [25].
In our study, younger women (aged 18–30) had higher odds of experiencing PMS. Our results were in accordance with the published data in previous studies [26,27]. While some studies found no significant association between age and PMS [28], others identified the highest prevalence in the 20–30 age group [27]. These discrepancies may have been attributed to variations in PMS diagnostic criteria, methodological approaches for defining the condition, and cultural norms used for upbringing of adolescents and place of the women in the society they live. Young women may have exhibited hormonal fluctuations leading to menstrual irregularities, prolonged periods which could contribute to increased frequency and severity of PMS symptoms.
In the present study, a significant association was observed between BMI and PMS prevalence. Our findings are consistent with previous studies suggesting that excessive adipose tissue contributes to PMS pathophysiology through hormonal dysregulation and chronic low-grade inflammation [29,30]. Although some studies have reported conflicting results due to differences in sample characteristics and diagnostic criteria [31], the association observed in our study may be biologically explained by an increase of aromatase activity in the adipose tissue, that increases peripheral estrogen levels and disrupts the hypothalamic–pituitary–gonadal (HPG) axis.
Educational level was a determinant of PMS prevalence. In our study, this relationship remained statistically significant, supporting the notion that limited educational attainment is an independent predictor of PMS, consistent with previous findings linking lower education with PMS risk [32]. In contrast, higher educational level has also been linked to PMS [33,34]. Educational standards are neither equivalent within a country, nor across the borders, or the continents.
The association between marital status and PMS remains inconclusive in the current literature. While some studies have indicated a higher prevalence of PMS among unmarried women, particularly younger populations, others have reported no significant relationship [35,36]. In our study, PMS was found to be more common among unmarried individuals. This pattern remained significant even after adjusting for other variables. However, there are also studies demonstrating higher PMS rates among married women, suggesting that marital status alone may not be a consistent predictor of PMS [37,38].
In our analysis, smoking emerged as an independent predictor of PMS, consistent with previous meta-analyses [39]. Nicotine's contribution to PMS pathogenesis may involve mood and hormonal dysregulation through dopaminergic and serotonergic pathways, exacerbating emotional lability and irritability; also enhancing sympathetic nervous system activity and disrupting HPG axis function [40,41]. Although caffeine intake has been associated with PMS in unadjusted analyses, this relationship was not statistically significant after adjustment for confounders such as BMI and education [41]. The consistent association between smoking, caffeine intake, and PMS in our study may have been attributed to the relatively young age and high symptom prevalence, which increased the statistical power to detect lifestyle-related effects.
The impact of PMS on quality of life has been widely investigated, with studies generally associating it with significant declines in physical and mental health components [16]. In contrast, individuals with PMS in our study demonstrated relatively higher quality of life scores. However, significant changes were observed in the mean scores of the Physical Functioning and Mental Health domains as PMS severity increased. While SF-36-based studies conducted in Turkey [42] and the United States [43] consistently reported substantial reductions in quality of life among individuals with PMS, relatively higher quality of life scores were observed in our study. This could be attributed to methodological differences, including the broader age and socioeconomic variability of our participants, the inclusion of non-student individuals, and the use of the comprehensive PAF scale for PMS assessment.
A study conducted in Southern California demonstrated that increasing PMS severity was associated with declines in SF-36 Mental and Physical Component Summary scores [44]. A study utilizing the SF-12 scale found that individuals with moderate to severe PMS had significantly lower mental and physical health scores [45]. Similarly, research on Iranian adolescents with PMS revealed lower SF-36 scores, particularly among individuals with severe PMS, where mental health and vitality scores were disproportionately affected [46].
In the present study, the severe PMS group exhibited higher mean scores in the physical functioning and mental health SF-36 domains. Although this finding might have initially appeared contradictory, it could have been methodologically explained. The proportion of participants with severe PMS was only 8.8% of the total sample, and the limited variance within this small subgroup may have allowed outlier values to disproportionately influence the group mean. Additionally, the SF-36 is a generic health assessment tool with limited capacity to reflect the cyclical, symptom-specific nature of PMS. The data were collected at a single time point, which increases the likelihood of participants being assessed during an asymptomatic phase. Therefore, the elevated scores in these domains should not be interpreted as genuinely better quality of life, but rather as a reflection of methodological factors such as sample composition, timing of measurement, and the inherent limitations of the assessment instrument.
Even though some studies have reported negative effects of PMS on psychological well-being [8,13], the impact of PMS on physical performance was variable. While some evidence reported reduced functional capacity [16], other findings highlighted the potential mitigating role of regular physical activity [4,26]. In our study, the association between SF-36 mental health and physical functioning domain scores and PMS severity were of low level. Consequently, our cohort could not show either a moderate or high relation between PMS severity and the scores of each domain of the SF-36.
One of the limitations of our study is that the use of convenience sampling from a tertiary care center may restrict the generalizability of our findings to the whole population. Secondly, variables such as physical activity, sleep, diet, alcohol consumption, menstrual cycle regularity and history of PMS in mother or sister which are considered as potential influencers of PMS prevalence were not assessed. Additionally, psychological distress, individual living status, economic situation that might affect women’s quality of life were also not evaluated. Moreover, the differences in study populations in terms of age, physical activity and nutrition result to a wide range of PMS in various countries. Furthermore, the use of various measuring tools is probably the main factor for the differences observed in the literature in terms of prevalence. Thus, our results should be confirmed in populations of similar sample size and individual characteristics. More importantly, many studies have been designed based on limited sample sizes. Intra-country and inter-country variations in PMS prevalence should be expected.
Multicenter and longitudinal studies with large sample sizes must be designed to determine the personal, communal, cultural and national features modifying PMS prevalence and its impact on quality of life. Consequently, national PMS screening and management protocols should be developed based on the prevalence in a given country population.
Conclusion
This study identified younger age, higher BMI, lower educational attainment, unmarried status, and smoking as independent predictors of PMS. Although caffeine intake was associated with PMS in bivariate analyses, it was not confirmed as an independent risk factor after adjustment. While PMS was linked to a higher symptom burden, its overall impact on quality of life was limited to specific domains, notably the physical functioning and mental health domains of the SF-36. Nevertheless, the link between the scores of these domains and PMS severity was of low level. PMS screening and management strategies must be incorporated into routine gynecological practice, based on current data gathered from the women living in that community.
Ethical considerations
The study protocol was revised and approval by the Institutional Review Board of the Faculty of Medicine of Marmara University (Protocol No: 09.2018.685). Informed consent was obtained from all participants involved in this study.
Author’s contribution
Rezzan Berna Baki and Tevfik Yoldemir were involved in the study conception and design. Rezzan Berna Baki carried out the surveys and performed the statistical analysis. Rezzan Berna Baki and Tevfik Yoldemir performed drafting of the manuscript. Both authors were involved in critically revising the manuscript for its intellectual content, and approved the final version.